 GeoData.NZ
AIR TEMPERATURE
Type of resources
Available actions
Topics
Keywords
Contact for the resource
Provided by
Years
Update frequencies
status
-
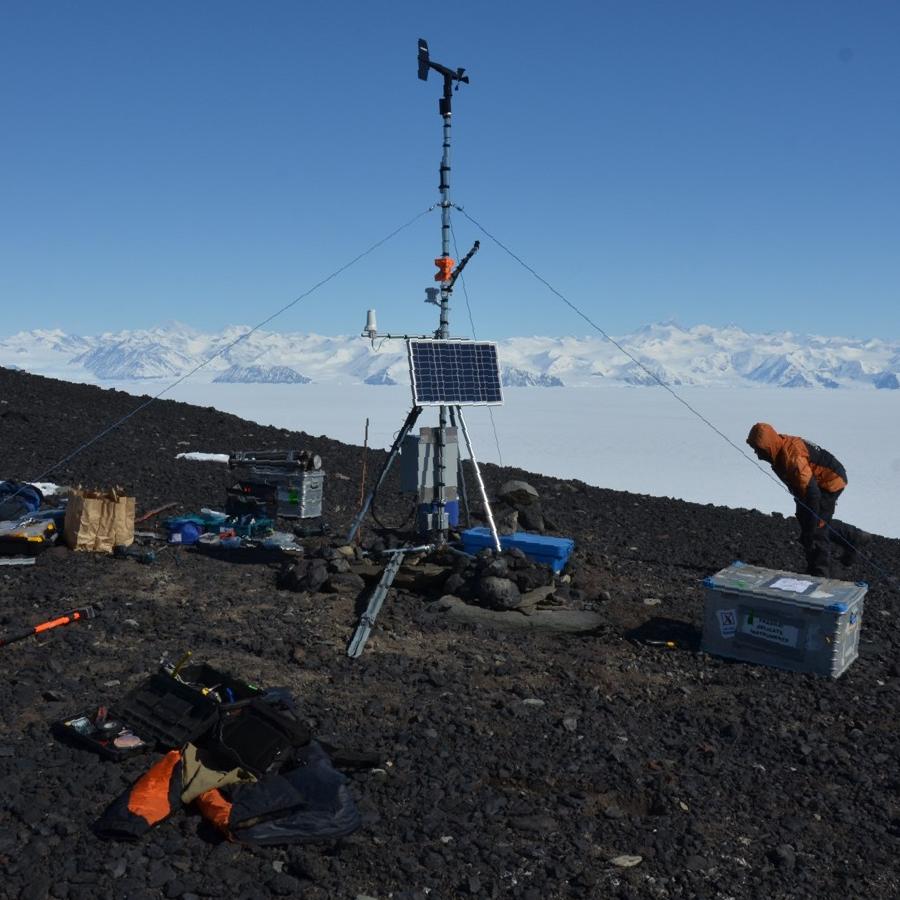
An automated weather station operates at Cape Adare (-71.30492, 170.23256). The station was established in 2014 and continues to transmit live data. Data are logged every 30 minutes. Parameters: - Air Temperature (C) - Relative Humidity (%) - Solar Radiation (W/m2) - PAR (uE) - Wind Speed (m/s) - Wind Gust (m/s) - Wind Direction (true bearing degrees) GET DATA: adminteam@antarcticanz.govt.nz
-
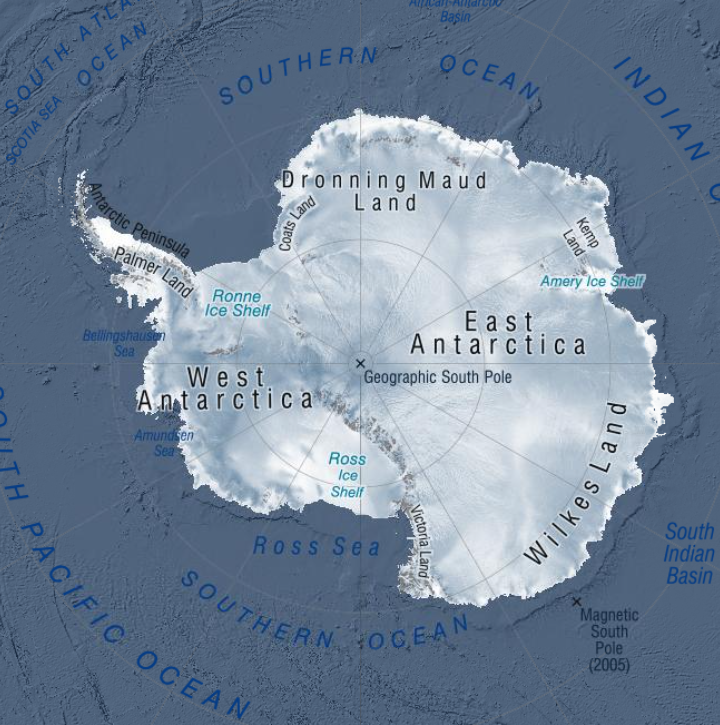
AntAir ICE is an air temperature dataset for terrestrial Antarctica, the ice shelves, and the seasonal sea ice around Antarctica in a 1km2 spatial grid resolution and a daily temporal resolution available from 2003-2021. AntAir ICE was produced by modelling air temperature from MODIS ice surface temperature and land surface temperature using linear models. In-situ measurements of air temperature from 117 Automatic Weather Stations were used as the response variable. Each day has a bricked spatial raster with two layers, saved as a GeoTIFF format and in the Antarctic Polar Stereographic projection (EPSG 3031). The first layer is the predicted near surface air temperature for that day in degree Celsius * 10 and the second layer is the number of available MODIS scenes for that day ranging from 0 to 4. Areas with cloud contamination or without sea ice are marked with no data. Files for each year (2003-2021) are compressed with a ZIP files for each quarter. Python 3.8 was used for conversion of the MODIS products from HDF files to raster and all data handling and processing was thereafter done in R version 4.0.0. All data processing and modelling procedures are available as R scripts on a public Github repository: https://github.com/evabendix/AntAir-ICE. Using this code it is possible to download new available MODIS LST and IST scenes and apply the model to continue the near-surface air temperature dataset. Related Publication: https://doi.org/10.1038/s41597-023-02720-z GET DATA: https://doi.org/10.1594/PANGAEA.954750
-
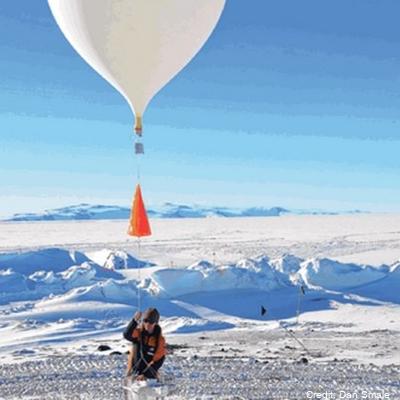
Altitude profile measurements of water vapour, ozone and aerosols using balloon packages flown through the troposphere into the stratosphere as part of the Ross Island GRUAN site activities. Maximum altitude recorded was 29 km. This project is a collaboration between the National Institute of Water and Atmospheric Research (NIWA) and NOAA. Timeline: - November 2022: 2 flights - February 2023: 1 flight - October 2023: 3 flights Data are held internally at NIWA and NOAA, and will be stored in the GRUAN database (https://www.gruan.org/data) GET_DATA: https://www.gruan.org/data
-

Climate data have been collected at Scott Base continuously since 1957 and more recently from Arrival Heights and is one of the longest continuous climate records in Antarctica. Climate parameters measured include: wind speed and direction, air temperature, relative humidity, barometric pressure, and global, diffuse and direct solar radiation. Climate data are collected on a daily basis from both sites. At Scott Base, this takes two forms: a standard daily observation at 0900 NZDT, and continuous data collection at 10 minute and hourly intervals using a CR10X data logger. The initial record of the 0900 daily observations began on 1 March 1957 with air temperature, air pressure, wind speed and direction, and global solar radiation being measured with standard instrumentation (wind measurements since 1972). This record constitutes the reference record. In January 1997 an electronic weather station (EWS) was added to collect and archive 10 minute and hourly data. The daily manual observations continued so as to provide a continuous reference and daily record. Historically, Arrival Heights only had a wind recorder (since January 1984). A data logger was installed in January 1999 and measured air temperature, relative humidity and global solar radiation using a secondary network sensor, as well as wind speed and direction. A barometric pressure sensor was installed in 2001. A standard 10m mast was installed and all sensors were moved to the new Arrival Heights laboratory in 2007. 10-minute and hourly data are recorded. Data are retrieved and archived from both automatic stations daily, as well as manual observations from Scott Base and available on New Zealand's national climate database. From February 2019, mercury theremometers and barometers were removed from Scott Base and Arrival Heights. Where applicable, these were replaced with electronic instruments. A weighing precipitation gauge was also installed in February 2019 for the measurement of solid precipitation at Scott Base. GET DATA: https://cliflo.niwa.co.nz/
-
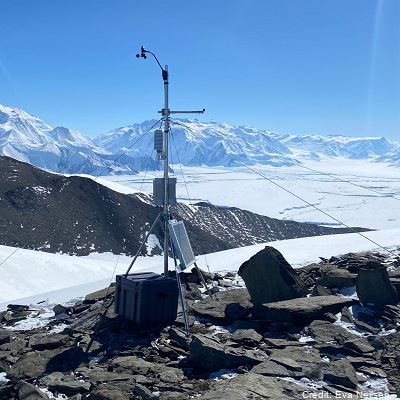
Automated weather stations were installed to measure local scale weather conditions at Miers Valley, Miers Ridge, Commonwealth Glacier, Cape Christie, and Haystack Mountain. Miers Valley, Miers Ridge and Haystack Mountain stations have been operating since early 2021, Haystack, Commonwealth Glacier and Cape Christie were installed in December 2021, 2022, and 2023, respectively. Data are available on request in NetCDF. Parameters: - average air temperature (C) - average relative humidity (%) - average short wave in (W/m2) - average pressure (hPa) - wind speed (ms-1) - wind direction (true bearing degrees) - wind standard deviation Coordinates: - Miers Valley (-78.09805, 163.794283) - Miers Ridge (-78.123205, 163.863319) - Commonwealth Glacier (-77.563987, 163.281064) - Cape Christie (-72.29722222, 169.9847222) - Haystack Mountain (-77.05, 162.585) GET DATA: marwan.katurji@canterbury.ac.nz
-
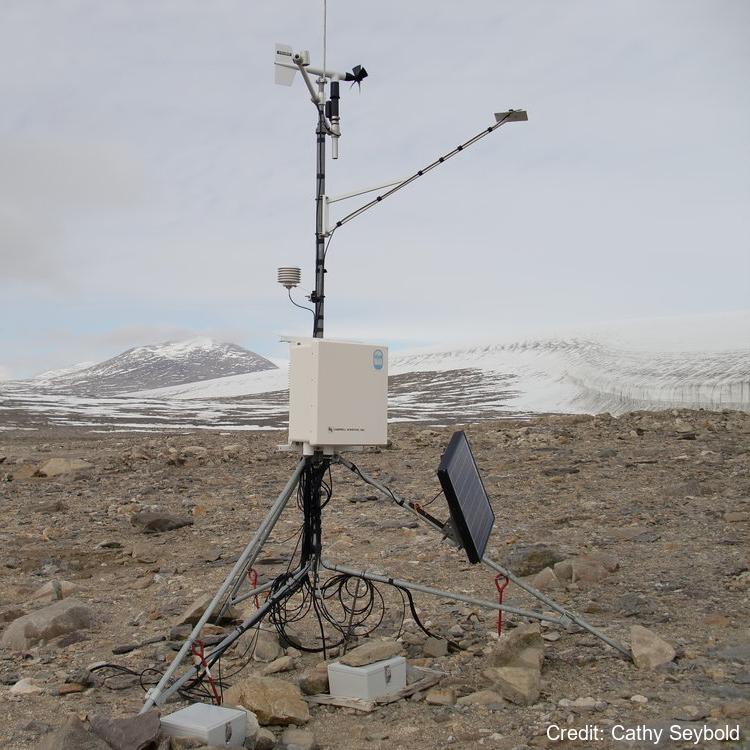
There are nine soil climate stations located in the McMurdo Sound region of Antarctica that were established starting in 1999 through 2011. Four of the stations are in the Dry Valleys and four are located along the coast. The ninth station is located on Mt. Fleming near the polar plateau. Each climate station measures atmospheric parameters (air temperature, relative humidity, wind speed and direction, and solar radiation) and soil parameters (soil moisture and temperature) that extend from the active layer (seasonally thawed layer) into the permafrost. Recorded measurements are made on an hourly basis. At each climate station the soils have been sampled and characterized at the Kellogg Soil Survey Laboratory. There are two borehole stations at Bull Pass and Marble Point which measure ground temperature and are used to study permafrost temperatures and active-layer thermal regimes to a depth of 30m. Further station and borehole details including the instruments' specification, maintenance, and measured variables are described in each site's data "_description" folder. GET DATA: https://www.nrcs.usda.gov/resources/data-and-reports/soil-climate-research-stations
-
The New Zealand Terrestrial Antarctic Biocomplexity Survey (nzTABS) is the largest and most comprehensive interdisciplinary landscape-scale study of terrestrial biology ever undertaken in Antarctica, incorporating fieldwork of 1500+ person days in 6 of the Dry Valleys (total area of 6500 km2), strategic sampling of over 1200 sites designed to encompass the landscape heterogeneities in the ecosystem, and a range of high-resolution remote sensing data. All samples were collected during the month of January in each sampling year. Initially a 220 km2 study area, consisting of Miers, Marshall, and Garwood Valleys as well as Shangri-La, was divided into more than 600 geographically and geologically distinct ice-free sectors (hereinafter “tiles”) using remote-sensing data and published soil maps. Tile boundaries were delineated where the combination of geographical and geological variables changed, and on-the-ground assessments were carried out in November 2008 to confirm the reliability of delineations. 554 tiles were chosen for sampling to encompass the entire range of geographical and geological heterogeneity. Sampling of soils and biological communities was carried out over two successive austral summers (January 2009 and January 2010). Surveys were conducted for vegetation (i.e., mosses, lichens, algal and cyanobacterial mats), lithic microbial communities, and invertebrates at each sampling site (verified by GPS to be inside its respective tile), followed by collection of bulk soil samples for additional analyses, including molecular analyses of bacteria (total and cyanobacteria-only) and fungi. In addition, a number of key variables were derived from satellite imagery, including surface soil temperature, a topographically derived ‘wetness index’, and distance to the coast. After quality control, data for 490 samples were included in the analysis. These data represent geochemistry and geomorphology to population genetics and microbial ecology parameters. Further details are provided at https://doi.org/10.1038/s42003-018-0274-5. Please cite the data with the following citation: Lee, C.K., Laughlin, D.C., Bottos, E.M. et al. Biotic interactions are an unexpected yet critical control on the complexity of an abiotically driven polar ecosystem. Commun Biol 2, 62 (2019). https://doi.org/10.1038/s42003-018-0274-5